We look at 23 cities in Colombia that are experiencing a big increase in coronavirus cases with 82 percent of new cases in Colombia from May 6 to July 24.
In the 80 days from August 15 to November 2, a total of 71 percent of the coronavirus cases in Colombia were in the 27 cities of Apartadó, Armenia Barrancabermeja, Barranquilla, Bello, Bucaramanga, Bogotá, Cali, Cartagena, Cúcuta, Dosquebradas, Envigado, Ibagué, Itagüí, Manizales, Medellín, Monteria, Neiva, Pasto, Pereira, Santa Marta, Sabanalarga, Sincelejo, Soacha, Soledad, Valledupar and Villavicencio, with the 27 cities in Colombia averaging 6,032 cases per day.
The over 1,100 other municipalities in Colombia not including these 27 cities during the same 80 days averaged 2,504 cases per day.
Bogotá is the largest city in Colombia with the most cases. Also, we added Apartadó, Armenia, Barrancabermeja, Bello, Bucaramanga, Cali, Cartagena, Dosquebradas, Envigado, Galapa, Ibagué, Itagüí, Manizales, Medellín, Monteria, Neiva Pasto, Pereira, Puerto Colombia, Quibdó, Santa Marta, Sincelejo, Soacha, Soledad, Valledupar and Villavicencio to the red city list due to an increase in cases.
In this article, we look at the 23 of the 27 cities in Colombia that are experiencing a major increase in coronavirus cases in more detail.
Problem Coronavirus Cities in Colombia
This following chart shows the increase in coronavirus cases in Colombia over a period of 80 days is primarily due to a substantial increase in cases in only the 27 cities of Apartadó, Armenia Barrancabermeja, Barranquilla, Bello, Bucaramanga, Bogotá, Cali, Cartagena, Cúcuta, Dosquebradas, Envigado, Ibagué, Itagüí, Manizales, Medellín, Monteria, Neiva, Pasto, Pereira, Santa Marta, Sabanalarga, Sincelejo, Soacha, Soledad, Valledupar and Villavicencio. The rest of Colombia not including these 27 cities has a relatively flat curve of new cases (blue line).

7-day running average of new daily coronavirus cases in Colombia, data source: Instituto Nacional de Salud, Nov. 2
This chart shows a running 6-day average of new coronavirus cases in Colombia along with the 7-day running average in the 27 red cities and the rest of Colombia. Note the red line is the 27 red cities and the blue line is all the rest of the cities in Colombia. And the black line is a running 7-day average of cases for all of Colombia.
The rest of Colombia (blue line) not including these 27 cities has a relatively flat curve of new cases except for starting to increase in the past six weeks.
We next look in detail at the 23 of the 27 red cities in Colombia with data from July 24 that are experiencing a big increase in coronavirus cases:

View of Bogotá from Monserrate
1. Coronavirus Situation in Bogotá
The following is the coronavirus status in Bogotá on July 24 according to Instituto Nacional de Salud (INS):
- Total cases: 77,889
- New cases from May 6 to July 24: 75,344
- Active cases: 43,667
- Coronavirus deaths: 2,000
- Coronavirus hospitalization: 4,873 in the hospital including 335 in the ICU
Bogotá is the largest city in Colombia with a metro population of over 10 million. On July 24, Bogotá had 77,889 cases or 31.3 percent of the total cases in Colombia.
The first coronavirus case in Bogotá was on March 6, 2020. And the peak of new daily coronavirus cases in Bogotá was reached on July 23 with 3,750 cases.
The following chart is the rolling 6-day average of new daily coronavirus cases in Bogotá.

6-day rolling average of new daily coronavirus cases in Bogotá, data source: Instituto Nacional de Salud, 7/24
This rolling 6-day average chart for Bogotá shows that on average, the number of new cases started to drop in Bogotá after reaching a peak but then started to increase again heading to a new average peak, which impacted the overall Colombia curve.
Bogotá is the largest city in Colombia and has been experiencing from 800 to over 3,500 new cases daily over the past month.

View of Barranquilla, photo by Jdvillalobos
2. Coronavirus Situation in Barranquilla
The following is the coronavirus status in Barranquilla on July 24 according to Instituto Nacional de Salud (INS):
- Total cases: 26,788
- New cases from May 6 to July 24: 26,503
- Active cases: 8,457
- Coronavirus deaths: 1,381
- Coronavirus hospitalization: 1,101 in the hospital including 120 in the ICU
Barranquilla the fourth largest city in Colombia with a metro population of about 2.4 million. On July 24, Barranquilla had 26,788 coronavirus cases, which was 11.4 percent of the total cases in Colombia.
The first coronavirus case in Barranquilla was on March 16, 2020. And the peak of new coronavirus cases in Barranquilla was reached on July 18 with 1,527 cases.
Barranquilla is a major coronavirus problem area in Colombia with four municipalities in the metro area showing up on our list of problem cities: Barranquilla, Soledad, Malambo and Galapa. These four municipalities in the Barranquilla metro area have a total of 40,741 coronavirus cases on July 24, which was 17.4 percent of the cases in Colombia.
The following chart is a rolling 6-day average of new coronavirus cases in Barranquilla.

6-day rolling average of new daily coronavirus cases in Barranquilla, data source: Instituto Nacional de Salud, 7/24
This rolling 6-day average chart shows that on average, Barranquilla has been experiencing an increase in coronavirus cases for well over a month heading to a peak, which impacted the overall Colombia curve. But over the past week has started to drop from this peak.

View of Cali from the Three Crosses hill in Cali , photo by C Arrango
3. Coronavirus Situation in Cali
The following is the coronavirus status in Cali on July 24 according to Instituto Nacional de Salud (INS):
- Total cases: 15,611
- New cases from May 6 to July 24: 14,704
- Active cases: 6,885
- Coronavirus deaths: 546
- Coronavirus hospitalization: 1,317 in the hospital including 249 in the ICU
Cali is the third largest city in Colombia with a metro population of about 3.4 million. On July 24, Cali had 15,611 cases or 6.7 percent of the total cases in Colombia.
The first coronavirus case in Cali was on March 15, 2020. And the peak of new daily coronavirus cases in Cali was reached on July 22 with 625 cases.
The following chart is a rolling 6-day average of new coronavirus cases in Cali.

6-day rolling average of new daily coronavirus cases in Cali, data source: Instituto Nacional de Salud, 7/24
This rolling 6-day average chart shows that on average, the number of new cases in Cali have been increasing at a fairly steady rate with some minor ups and downs, which impacted the overall Colombia curve.

View of Cartagena, Colombia
4. Coronavirus Situation in Cartagena
The following is the coronavirus status in Cartagena on July 24 according to Instituto Nacional de Salud (INS):
- Total cases: 14,128
- New cases from May 6 to July 24: 13,747
- Active cases: 3,831
- Coronavirus deaths: 438
- Coronavirus hospitalization: 308 in the hospital including 47 in the ICU
Cartagena is the fifth largest city in Colombia with a metro population of about 1 million. On July 24, Cartagena had 14,128 coronavirus cases, which was 6.0 percent of the total cases in Colombia.
The first coronavirus case in Cartagena was on March 11, 2020. And the peak of new daily coronavirus cases in Cartagena was reached on June 16 with 683 cases.
The following chart is a rolling 6-day average of new coronavirus cases in Cartagena.

6-day rolling average of new daily coronavirus cases in Cartagena, data source: Instituto Nacional de Salud, 7/24
This rolling 6-day average chart shows that on average, the number of new cases in Cartagena experienced an increase in heading to a peak and have stayed at over 100 cases per day even after dropping from that peak, which impacted the overall Colombia curve.

View of Medellín from Cerro de Las Tres Cruces
5. Coronavirus Situation in Medellín
The following is the coronavirus status in Medellín on July 24 according to Instituto Nacional de Salud (INS):
- Total cases: 12,168
- New cases from May 6 to July 24: 11,856
- Active cases: 9,020
- Coronavirus deaths: 177
- Coronavirus hospitalization: 671 in hospital including 108 in the ICU
Medellín is the capital of the Antioquia department in Colombia and has a metro population of about 4 million people. On July 6, Medellín had 12,168 coronavirus cases, which was 5.2 percent of the total cases in Colombia.
The first coronavirus case in Medellín was on March 16, 2020. And the peak of new coronavirus cases in Medellín was reached on July21 with 1,052 cases.
The following chart is a rolling 6-day average of new coronavirus cases in Medellín.

6-day rolling average of new daily coronavirus cases in Medellín, data source: Instituto Nacional de Salud, 7/24
This rolling 6-day average trend chart shows that on average, the number of cases per day in Medellín was much fewer than 100 and started to increase in mid-June heading to a new peak, which impacted the overall curve for Colombia.
6. Coronavirus Situation in Soledad
The following is the coronavirus status in Soledad on July 24 according to Instituto Nacional de Salud (INS):
- Total cases: 10,639
- New cases from May 6 to July 24: 10,425
- Active cases: 2,819
- Coronavirus deaths: 560
- Coronavirus hospitalization: 518 in hospital including 60 in the ICU
Soledad is a coastal municipality in the Atlántico department of Colombia with a population of about 680,000. Soledad is part of the Barranquilla metro area but coronavirus cases are reported separately for Soledad from Barranquilla.
On July 24, Soledad had 10,639 coronavirus cases, which was 4.5 percent of the total cases in Colombia.
The first case in Soledad was on March 25, 2020. And the peak of new daily coronavirus cases in Soledad was reached on June 26 with 460 cases.
The following chart is a rolling 6-day average of new coronavirus cases in Soledad.

6-day rolling average of new daily coronavirus cases in Soledad, data source: Instituto Nacional de Salud, 7/24
This rolling 6-day average chart shows that on average, the number of new cases per day was low until the number started increasing in May and started to head to a peak in June, which impacted the overall Colombia curve. After that peak, cases dropped and headed to a new peak and dropped again the in past week.
7. Coronavirus Situation in Sincelejo
The following is the coronavirus status in Sincelejo on July 24 according to Instituto Nacional de Salud (INS):
- Total cases: 3,936
- New cases from May 6 to July 24: 3,936
- Active cases: 2,307
- Coronavirus deaths: 246
- Coronavirus hospitalization: 439 in hospital including 18 in the ICU
Sincelejo is the capital and largest city of the Sucre department in Colombia with a population of over 280,000. Sincelejo is located about 30 kilometers from the Caribbean Sea and is about 125 kilometers from Cartagena.
On July 24, Sincelejo had 3,936 coronavirus cases, which was 1.7 percent of the total cases in Colombia.
The first case in Sincelejo was on March 25, 2020. And the peak of new daily coronavirus cases in Sincelejo was reached on July 18 with 414 cases.
The following chart is a rolling 6-day average of new coronavirus cases in Sincelejo.

6-day rolling average of new daily coronavirus cases in Sincelejo, data source: Instituto Nacional de Salud, 7/24
This rolling 6-day average chart shows that on average, the number of new cases in Sincelejo per day was low per day but the city started to experience an increase in coronavirus cases in early June heading to a peak, which impacted the overall Colombia curve.
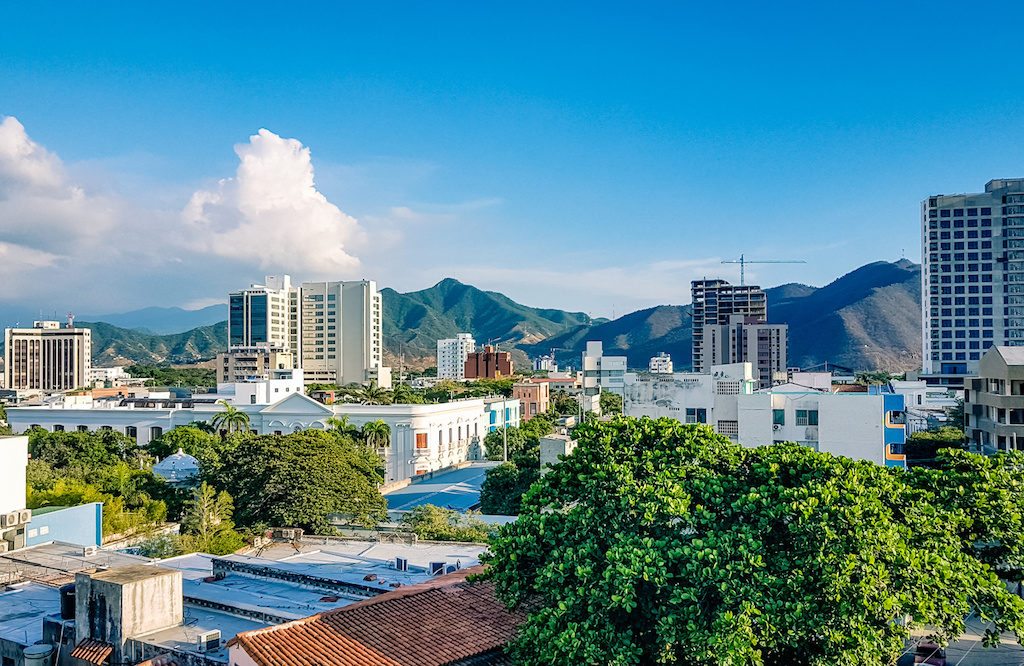
Santa Marta Skyline
8. Coronavirus Situation in Santa Marta
The following is the coronavirus status in Santa Marta on July 24 according to Instituto Nacional de Salud (INS):
- Total cases: 3,004
- New cases from May 6 to July 24: 2,823
- Active cases: 1,520
- Coronavirus deaths: 126
- Coronavirus hospitalization: 206 in hospital including 24 in the ICU
Santa Marta is a coastal city and is the capital of the Magdalena department of Colombia with a population of over 500,000. On July 24, Santa Marta had 3,004 coronavirus cases, which was 1.3 percent of the total cases in Colombia.
The first case in Santa Marta was on March 20, 2020. And the peak of new daily coronavirus cases in Santa Marta was reached on July 17 with 249 cases.
The following chart is a rolling 6-day average of new coronavirus cases in Santa Marta.

6-day rolling average of new daily coronavirus cases in Santa Marta, data source: Instituto Nacional de Salud, 7/24
This rolling 6-day average chart shows that on average, the number of new cases in Santa Marta per day was below 25 per day but the city started to experience an increase in coronavirus cases in mid-June heading to a peak, which impacted the overall Colombia curve.
9. Coronavirus Situation in Pasto
The following is the coronavirus status in Pasto on July 24 according to Instituto Nacional de Salud (INS):
- Total cases: 2,673
- New cases from May 6 to July 24: 2,636
- Active cases: 1,852
- Coronavirus deaths: 57
- Coronavirus hospitalization: 202 in hospital including 15 in the ICU
Pasto is the capital of the department of Nariño, in southern Colombia with a population of about 460,000. On July 24, Pasto had 2,673 coronavirus cases, which was 1.1 percent of the total cases in Colombia.
The first case in Pasto was on March 28, 2020. And the peak of new daily coronavirus cases in Pasto was reached on July 20 with 214 cases.
The following chart is a rolling 6-day average of new coronavirus cases in Pasto.
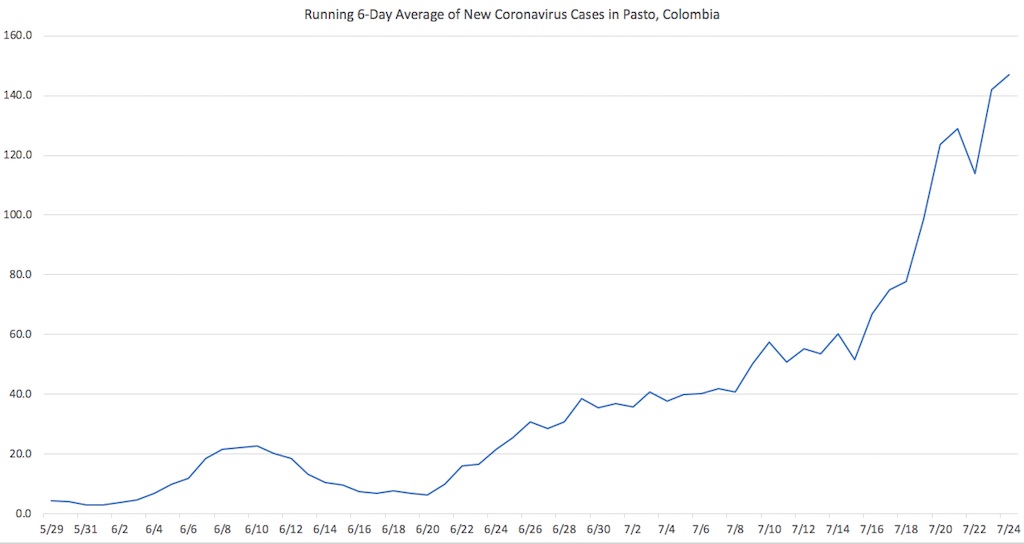
6-day rolling average of new daily coronavirus cases in Pasto, data source: Instituto Nacional de Salud, 7/24
This rolling 6-day average chart shows that on average, the number of new cases in Pasto per day was low but the city started to experience an increase in coronavirus cases in mid-June and hit a peak then dropped slightly and headed to a new peak, which impacted the overall Colombia curve.
10. Coronavirus Situation in Soacha
The following is the coronavirus status in Soacha on July 24 according to Instituto Nacional de Salud (INS):
- Total cases: 2,654
- New cases from May 6 to July 24: 2,571
- Active cases: 1,308
- Coronavirus deaths: 65
- Coronavirus hospitalization: 221 in hospital including 15 in the ICU
Soacha is part of the Bogotá metropolitan area with a population of over 500,000. On July 6, Soacha had 2,654 coronavirus cases, which was 1.1 percent of the total cases in Colombia.
The first case in Soacha was on March 17, 2020. And the peak of new daily coronavirus cases in Soacha was reached on July 10 with 159 cases.
The following chart is a rolling 6-day average of new coronavirus cases in Soacha.

6-day rolling average of new daily coronavirus cases in Soacha, data source: Instituto Nacional de Salud, 7/24
This rolling 6-day average chart shows that on average, the number of new cases in Soacha per day was averaging below 25 per day until it started increasing in mid-June heading to a peak, which impacted the overall Colombia curve.
11. Coronavirus Situation in Leticia
The following is the coronavirus status in Leticia on July 24 according to Instituto Nacional de Salud (INS):
- Total cases: 2,345
- New cases from May 6 to July 24: 2,164
- Active cases: 63
- Coronavirus deaths: 98
- Coronavirus hospitalization: 12 in the hospital including 5 in the ICU
Leticia is a small city in the Amazonas department in Colombia with a city population of only about 50,000. Leticia is on the left bank of the Amazon river and is located at the border of Colombia where Colombia, Brazil and Peru come together.
On July 24, Leticia had 2,345 cases, which was 1.0 percent of the total cases in Colombia.
The first coronavirus case in Leticia wasn’t until April 17, 2020. And the peak of new daily coronavirus cases in Leticia was reached less than a month later on May 11 with 191 cases.
The following chart is a rolling 6-day average of new coronavirus cases in Leticia.

6-day rolling average of new daily coronavirus cases in Leticia, data source: Instituto Nacional de Salud, 7/24
This rolling 6-day average chart shows that on average, the number of new cases per day in Leticia was high back in May, which impacted the overall Colombia curve.
After hitting a peak, cases started to drop and since mid-June have been under 20 cases per day. Leticia is starting to drop down the red city list, it used to be in the top 6 cities.
Leticia has a cluster of cases in a prison, with at least 153 coronavirus cases in a prison with 190 inmates. Also, Leticia is on the border with Brazil and Peru with border crossings have reportedly been easy to do. The Colombian military reportedly sent 1,000 men to the border town to prevent travel to and from Brazil and Peru.
12. Coronavirus Situation in Monteria
The following is the coronavirus status in Monteria on July 24 according to Instituto Nacional de Salud (INS):
- Total cases: 2,112
- New cases from May 6 to July 24: 2,092
- Active cases: 1,393
- Coronavirus deaths: 232
- Coronavirus hospitalization: 229 in hospital including 30 in the ICU
Monteria is the capital city of department of Córdoba in Colombia located in northern Colombia about 32 miles (50 km) from the Caribbean coast. Monteria has a population of about 500,000.
On July 24, Monteria had 2,112 coronavirus cases, which was 0.9 percent of the total cases in Colombia.
The first case in Monteria was on April 11, 2020. And the peak of new daily coronavirus cases in Monteria was reached on July 18 with 322 cases.
The following chart is a rolling 6-day average of new coronavirus cases in Monteria.

6-day rolling average of new daily coronavirus cases in Monteria, data source: Instituto Nacional de Salud, 7/24
This rolling 6-day average chart shows that on average, the number of new cases in Monteria per day was averaging below 20 per day until it started increasing in late-June heading to a peak, which impacted the overall Colombia curve.
13. Coronavirus Situation in Quibdó
The following is the coronavirus status in Quibdó on July 24 according to Instituto Nacional de Salud (INS):
- Total cases: 2,090
- New cases from May 6 to July 24: 2,074
- Active cases: 569
- Coronavirus deaths: 58
- Coronavirus hospitalization: 168 in hospital including 26 in the ICU
Quibdó is the capital city of department of Chocó in Colombia located in western Colombia on the Atrato River. Quibdó has a population of over 130,000.
On July 24, Quibdó had 2,090 coronavirus cases, which was 0.9 percent of the total cases in Colombia.
The first case in Quibdó was on April 11, 2020. And the peak of new daily coronavirus cases in Quibdó was reached on July 1 with 122 cases.
The following chart is a rolling 6-day average of new coronavirus cases in Quibdó.

6-day rolling average of new daily coronavirus cases in Quibdó, data source: Instituto Nacional de Salud, 7/24
This rolling 6-day average chart shows that on average, the number of new cases in Quibdó per day was low but started to increase in mid-May and hit a peak in early July and then dropped and headed back up again, which impacted the overall Colombia curve.
14. Coronavirus Situation in Malambo
The following is the coronavirus status in Malambo on July 24 according to Instituto Nacional de Salud (INS):
- Total cases: 2,087
- New cases from May 6 to July 24: 2,036
- Active cases: 593
- Coronavirus deaths: 124
- Coronavirus hospitalization: 87 in hospital including 11 in the ICU
Malambo is a municipality in the Atlántico department of Colombia with a population of over 130,000. Malambo is part of the Barranquilla metro area but coronavirus cases are reported separately for Malambo from Barranquilla.
On July 24, Malambo had 2,087 coronavirus cases, which was 0.9 percent of the total cases in Colombia.
The first case in Malambo was on May 13, 2020. And the peak of new daily coronavirus cases in Malambo was reached on July 1 with 112 cases.
The following chart is a rolling 6-day average of new coronavirus cases in Malambo.

6-day rolling average of new daily coronavirus cases in Malambo, data source: Instituto Nacional de Salud, 7/24
This rolling 6-day average chart shows that on average, the number of new cases in Malambo per day has been going up and down and hit three peaks June and July which impacted the overall Colombia curve.
15. Coronavirus Situation in Buenaventura
The following is the coronavirus status in Buenaventura on July 24 according to Instituto Nacional de Salud (INS):
- Total cases: 1,984
- New cases from May 6 to July 24: 1,938
- Active cases: 430
- Coronavirus deaths: 130
- Coronavirus hospitalization: 145 in hospital including 27 in the ICU
Buenaventura is a coastal seaport city in the Valle del Cauca department of Colombia with a population of about 440,000. Buenaventura is the major port in Colombia, accounting for nearly 60 percent of all Colombian sea imports and exports.
On July 24, Buenaventura had 1,984 coronavirus cases, which was 0.8 percent of the total cases in Colombia.
The first case in Buenaventura was on April 5, 2020. And the peak of new daily coronavirus cases in Buenaventura was reached on May 30 with 124 cases.
The following chart is a rolling 6-day average of new coronavirus cases in Buenaventura.
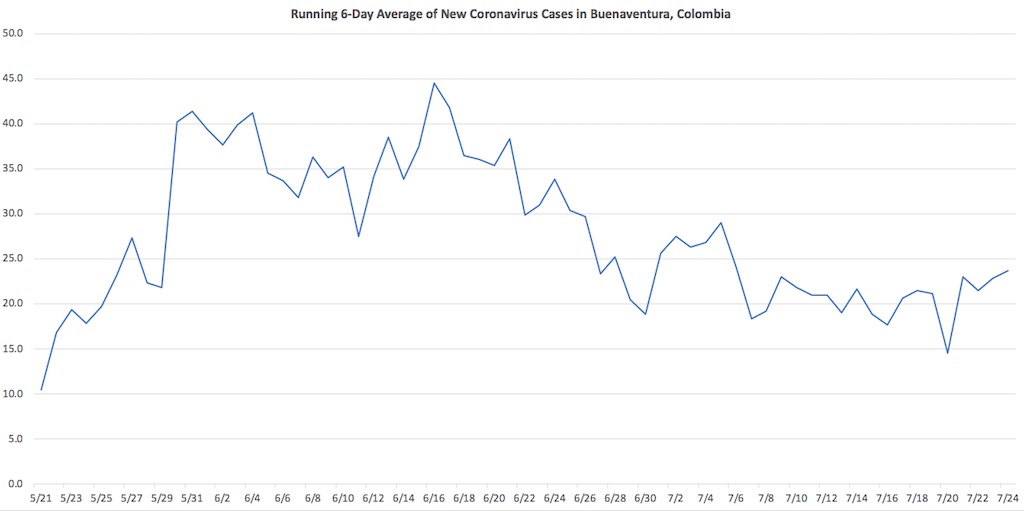
6-day rolling average of new daily coronavirus cases in Buenaventura, data source: Instituto Nacional de Salud, 7/24
This rolling 6-day average chart shows that on average, the number of new cases in Buenaventura per day was very low the city started to experience an increase in coronavirus cases in late May. Buenaventura started to head to a peak, which impacted the overall Colombia curve, but the number of cases started to drop somewhat after the peak.
16. Coronavirus Situation in Villavicencio
The following is the coronavirus status in Villavicencio on July 24 according to Instituto Nacional de Salud (INS):
- Total cases: 1,865
- New cases from May 6 to July 24: 1,145
- Active cases: 567
- Coronavirus deaths: 19
- Coronavirus hospitalization: 39 in hospital including 5 in the ICU
Villavicencio is the capital of the Meta department in Colombia and has a metro population of about 535,000 people. On July 24, Villavicencio had 1,865 coronavirus cases, which was 0.8 percent of the total cases in Colombia.
The first coronavirus case in Villavicencio was on March 13, 2020. And the peak of new coronavirus cases in Villavicencio was reached on May 5 with 154 cases.
The following chart is a rolling 6-day average of new coronavirus cases in Villavicencio.
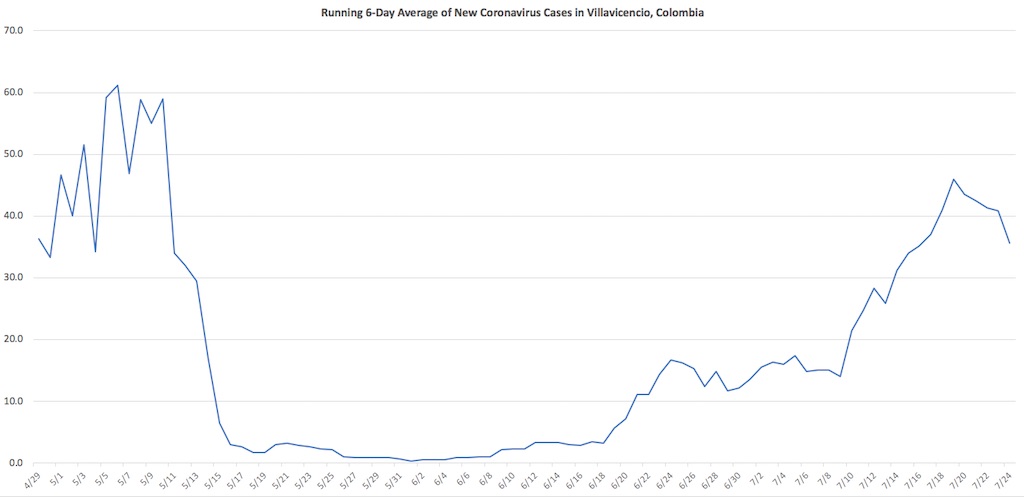
6-day rolling average of new daily coronavirus cases in Villavicencio, data source: Instituto Nacional de Salud, 7/24
This rolling 6-day average chart shows that on average, the number of new cases per day hit a peak in early May and then dropped low but started to head to a new peak in July, which impacted the overall Colombia curve.
Villavicencio has experienced a major outbreak of coronavirus cases in a prison with reportedly over 830 cases in the city located the prison. The prison is overcrowded with 1,750 inmates in a prison designed for 899 people.
17. Coronavirus Situation in San Andrés de Tumaco
The following is the coronavirus status in San Andrés de Tumaco on July 24 according to Instituto Nacional de Salud (INS):
- Total cases: 1,682
- New cases from May 6 to July 24: 1,594
- Active cases: 186
- Coronavirus deaths: 61
- Coronavirus hospitalization: 94 in hospital including 12 in the ICU
San Andrés de Tumaco is a port city in the Nariño department of Colombia with a metro population of over 200,000. San Andrés de Tumaco is located on the southwest corner of Colombia along the Pacific coast, near the border of Ecuador.
On July 24, San Andrés de Tumaco had 1,682 coronavirus cases, which was 0.7 percent of the total cases in Colombia.
The first case in San Andrés de Tumaco was on April 24, 2020. And less than a month later the peak of new daily coronavirus cases in San Andrés de Tumaco was reached on June 10 with 153 cases.
The following chart is a rolling 6-day average of new coronavirus cases in San Andrés de Tumaco.

6-day rolling average of new daily coronavirus cases in San Andrés de Tumaco, data source: Instituto Nacional de Salud, 7/24
This rolling 6-day average chart shows that on average, the number of new cases in San Andrés de Tumaco hit a peak in May, which impacted the overall Colombia curve. After hitting a peak, the number of cases per day dropped and have gone up and down.
San Andrés de Tumaco may eventually drop off the red cities list if cases continue to be low. We look at the number of cases in a rolling 80 days in considering which cities to include.
18. Coronavirus Situation in Valledupar
The following is the coronavirus status in Valledupar on July 24 according to Instituto Nacional de Salud (INS):
- Total cases: 1,537
- New cases from May 6 to July 24: 1,380
- Active cases: 785
- Coronavirus deaths: 26
- Coronavirus hospitalization: 100 in hospital including 7 in the ICU
Valledupar is the capital city of the Cesar department of Colombia with a population of about 500,000. On July 24, Valledupar had 1,537 coronavirus cases, which was 0.7 percent of the total cases in Colombia.
The first case in Valledupar was on March 22, 2020. And the peak of new daily coronavirus cases in Valledupar was reached on July 20 with 108 cases.
The following chart is a rolling 6-day average of new coronavirus cases in Valledupar.
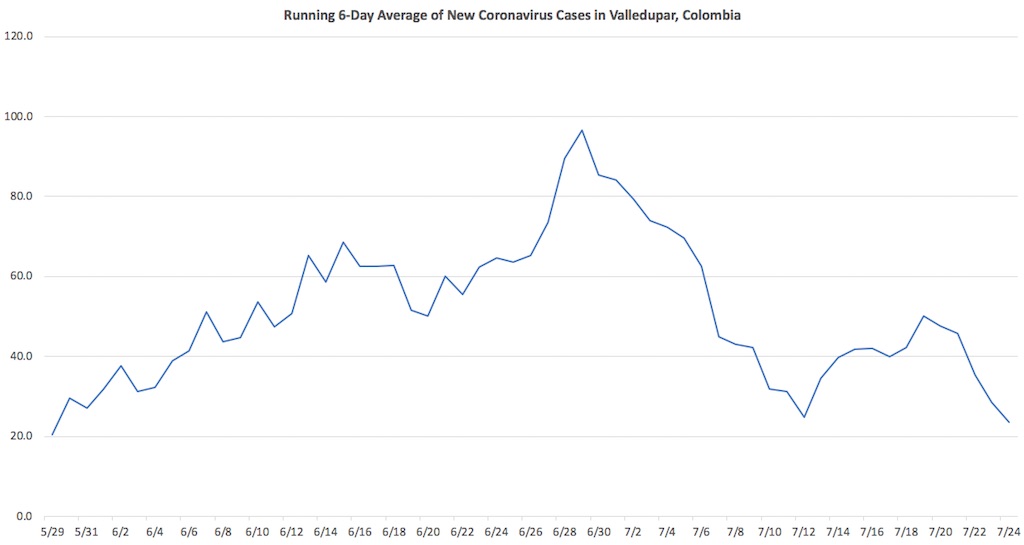
6-day rolling average of new daily coronavirus cases in Valledupar, data source: Instituto Nacional de Salud, 7/24
This rolling 6-day average chart shows that on average, the number of new cases in Valledupar per day was relatively low but the city started to experience an increase in coronavirus cases in late-May and hit a peak in late June, which impacted the overall Colombia curve but started to drop after hitting a peak.

The Puerta del Norte mall in Bello
19. Coronavirus Situation in Bello
The following is the coronavirus status in Bello on July 24 according to Instituto Nacional de Salud (INS):
- Total cases: 1,515
- New cases from May 6 to July 24: 1,462
- Active cases: 1,076
- Coronavirus deaths: 24
- Coronavirus hospitalization: 86 in hospital including 10 in the ICU
Bello is a municipality in the Antioquia department of Colombia located in the Aburrá Valley where Medellín is located. Bello has a population of about 550,000.
On July 24, Bello had 1,515 coronavirus cases, which was 0.6 percent of the total cases in Colombia.
The first case in Bello was on March 21, 2020. And the peak of new daily coronavirus cases in Bello was reached on July 21 with 131 cases.
The following chart is a rolling 6-day average of new coronavirus cases in Bello.

6-day rolling average of new daily coronavirus cases in Bello, data source: Instituto Nacional de Salud, 7/24
This rolling 6-day average chart shows that on average, the number of new cases in Bello per day was averaging below 10 per day until it started increasing in late-June heading to a peak, which impacted the overall Colombia curve.
20. Coronavirus Situation in Baranoa
The following is the coronavirus status in Baranoa on July 24 according to Instituto Nacional de Salud (INS):
- Total cases: 1,408
- New cases from May 6 to July 24: 1,405
- Active cases: 720
- Coronavirus deaths: 42
- Coronavirus hospitalization: 41 in hospital including 8 in the ICU
Baranoa is city a Atlántico department of Colombia with a population of about 400,000. Baranoa is located only about 22 km from Barranquilla, which has experienced a major outbreak of coronavirus cases.
On July 24, Baranoa had 1,408 coronavirus cases, which was 0.6 percent of the total cases in Colombia.
The first case in Baranoa was on April 12, 2020. And the peak of new daily coronavirus cases in Baranoa was reached on July 16 with 108 cases.
The following chart is a rolling 6-day average of new coronavirus cases in Baranoa.
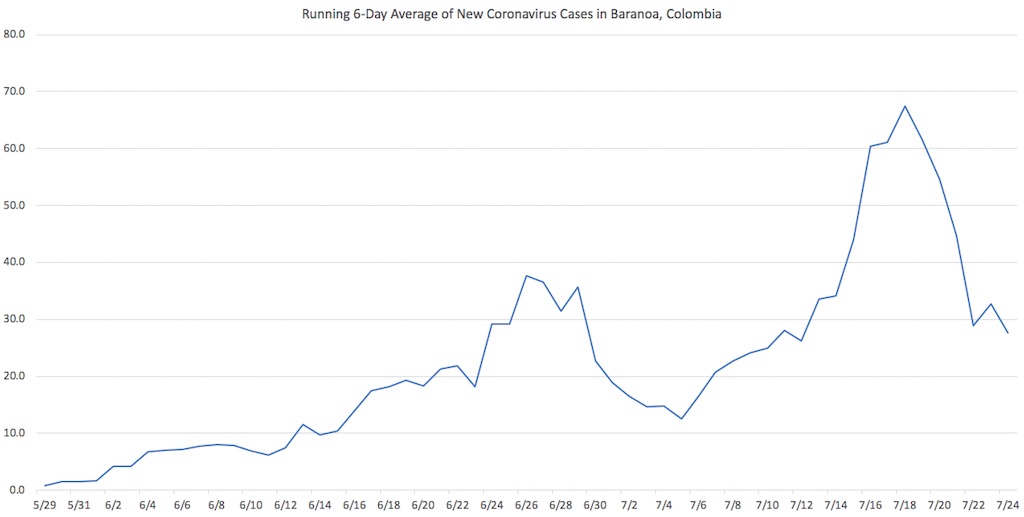
6-day rolling average of new daily coronavirus cases in Baranoa, data source: Instituto Nacional de Salud, 7/24
This rolling 6-day average chart shows that on average, the number of new cases in Baranoa per day was below 10 per day but the city started to experience an increase in coronavirus cases in early June heading to a peak, which impacted the overall Colombia curve but then dropped and started heading back up to a new peak and dropped again.
21. Coronavirus Situation in Itagüí
The following is the coronavirus status in Itagüí on July 24 according to Instituto Nacional de Salud (INS):
- Total cases: 1,355
- New cases from May 6 to July 24: 1,277
- Active cases: 503
- Coronavirus deaths: 46
- Coronavirus hospitalization: 40 in hospital including 4 in the ICU
Itagüí is a municipality in the Antioquia department of Colombia located in the Aburrá Valley where Medellín is located. Itagüí has a population of about 280,000.
On July 24, Itagüí had 1,355 coronavirus cases, which was 0.6 percent of the total cases in Colombia.
The first case in Itagüí was on March 11, 2020. And the peak of new daily coronavirus cases in Itagüí was reached on July 17 with 156 cases.
The following chart is a rolling 6-day average of new coronavirus cases in Itagüí.

6-day rolling average of new daily coronavirus cases in Itagüí, data source: Instituto Nacional de Salud, 7/24
This rolling 6-day average chart shows that on average, the number of new cases in Itagüí per day was averaging below 10 per day until it started increasing in late-June heading to a peak, which impacted the overall Colombia curve.
22. Coronavirus Situation in Galapa
The following is the coronavirus status in Galapa on July 24 according to Instituto Nacional de Salud (INS):
- Total cases: 1,227
- New cases from May 6 to July 24: 1,220
- Active cases: 367
- Coronavirus deaths: 60
- Coronavirus hospitalization: 39 in hospital including 5 in the ICU
Galapa is a municipality in the Atlántico department of Colombia with a population of about 45,000. Galapa is part of the Barranquilla metro area but coronavirus cases are reported separately for Galapa from Barranquilla.
On July 24, Galapa had 1,227 coronavirus cases, which was 0.5 percent of the total cases in Colombia.
The first case in Galapa was on April 8, 2020. And the peak of new daily coronavirus cases in Galapa was reached on June 24 with 68 cases.
The following chart is a rolling 6-day average of new coronavirus cases in Galapa.
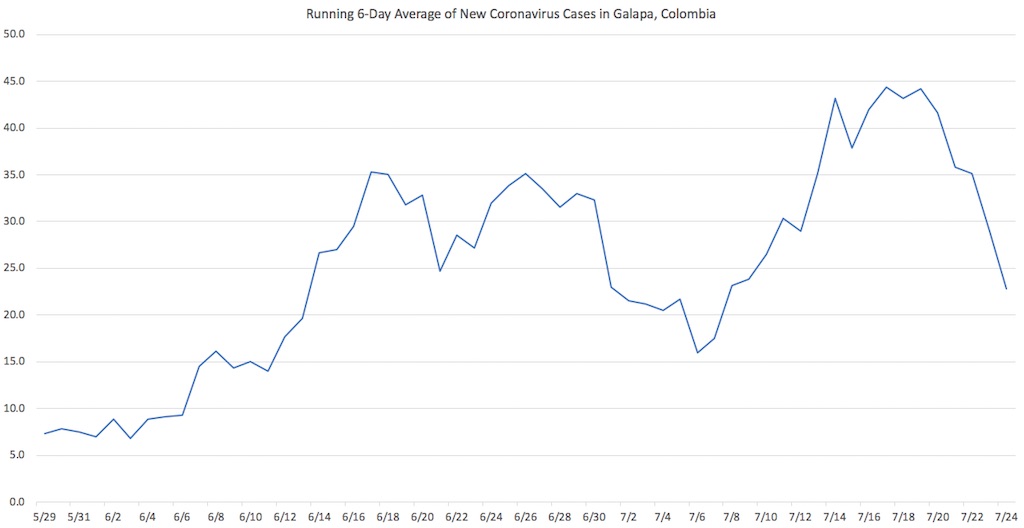
6-day rolling average of new daily coronavirus cases in Galapa, data source: Instituto Nacional de Salud, 7/24
This rolling 6-day average chart shows that on average, the number of new cases in Galapa per day was below 10 per day but the city started to experience an increase in coronavirus cases in early June heading to a peak, which impacted the overall Colombia curve. After hitting a first peak, the cases in Galapa dropped and headed to a new peak in July.
23. Coronavirus Situation in Puerto Colombia
The following is the coronavirus status in Puerto Colombia on July 24 according to Instituto Nacional de Salud (INS):
- Total cases: 1,032
- New cases from May 6 to July 24: 1,025
- Active cases: 414
- Coronavirus deaths: 44
- Coronavirus hospitalization: 24 in hospital including none in the ICU
Puerto Colombia is a coastal city in the Atlantico department of Colombia with a population of about 365,000. On July 24, Puerto Colombia had 1,032 coronavirus cases, which was 0.4 percent of the total cases in Colombia.
The first case in Puerto Colombia was on May 12, 2020. And the peak of new daily coronavirus cases in Puerto Colombia was reached on June 29 with 64 cases.
The following chart is a rolling 6-day average of new coronavirus cases in Puerto Colombia.
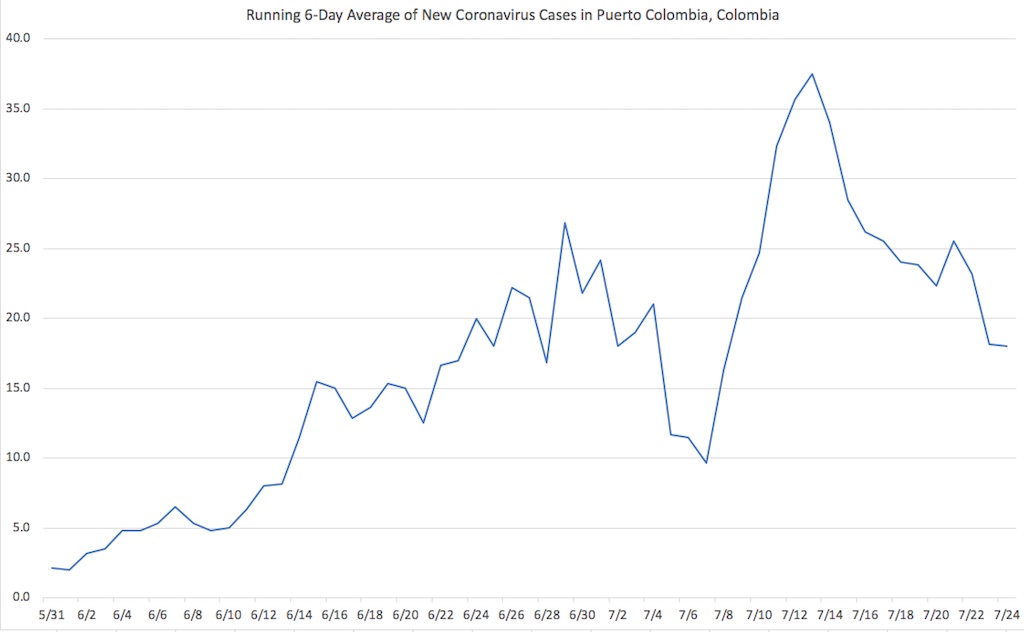
6-day rolling average of new daily coronavirus cases in Puerto Colombia, data source: Instituto Nacional de Salud, 7/24
This rolling 6-day average chart shows that on average, the number of new cases in Puerto Colombia per day was below 10 per day but the city started to experience an increase in coronavirus cases in early June heading to a peak, which impacted the overall Colombia curve. After hitting a first peak, the cases in Puerto Colombia dropped and headed to a new peak in July.
Medellin Guru’s Coronavirus Series
Medellin Guru has a series of articles about the coronavirus pandemic and the impacts in Colombia: Also, these articles are being kept up-to-date, as this is a fast-moving topic:
- Will the Quarantine Return to Colombia? What if Cases Increase?
- New Normal in Medellín: Medellín is Returning to Normal
- Colombia’s Quarantine Ends on September 1: New Phase Starts
- Tourism Impact of Coronavirus: Colombia Starts to Reactivate Tourism
- Economy Impacts in Colombia Due to Extended Quarantine
- Epicenter of Coronavirus in Colombia: Bogotá is the Epicenter
- Medellín Plans the Total Reopening of Economic Activities in the City
- When Will the Quarantine End in Colombia? On September 1?
- Humanitarian Flights from Colombia to the U.S. and Other Countries
- Beware of Fake News in Colombia About Coronavirus and Quarantines
- Reopening Gymnasiums, Churches and Movie Theaters in Colombia
- Reopening Amusement Parks, Zoos and Nature Reserves in Colombia
- Medellín Starts Free COVID-19 Tests on the Medellín Metro
- New COVID-19 Preventive Measures in Medellín to Contain the Pandemic
- Penalties for Violating the Quarantine in Medellín are Stiff
- COVID-19 Orange Alert in Bogotá: New Lockdowns in Bogotá
- Medellín Starts to Lift the Quarantine: Enters Smart Isolation Phase
- Colombia Started to Lift the Quarantine – What Does this Mean?
- Coronavirus: When Will the Quarantine Be Lifted in Colombia?
- Colombia Starts to Lift the Quarantine in COVID-19 Free Areas
- Colombia Quarantine: Nationwide Quarantine Extended to September 1
- Coronavirus in Colombia: Myth vs Reality – Current Status
- Coronavirus Hospitalization in Colombia: Myth vs Reality
- Are Medellín and Antioquia Winning the Coronavirus Battle?
- 23 Cities with a Major Increase in Coronavirus Cases in Colombia
- Colombia Coronavirus Death Rate: What are the Chances of Dying?
- Coronavirus: When Will Things Return to Normal in Colombia?
- COVID-19 Testing in Colombia: Realty About Coronavirus Testing
- Life as an Expat: During Medellín’s Coronavirus Quarantine
- Colombian Visa Process Changes: Due to Quarantine and Coronavirus
- Medellín Coronavirus Closures – What is Closed in Medellín?
- Pico y Cedula: A Restriction for Grocery Shopping in the Aburrá Valley During the Quarantine
- Pico y Cedula in Colombia: Which is Strictest Out of 5 Largest Cities?
- Medellín Quarantine Starts on March 20 for Four Days

7-day running average of new daily coronavirus cases in Colombia, data source: Instituto Nacional de Salud, Oct. 11
The Bottom Line: Cities with a Major Increase in Coronavirus Cases in Colombia
The bottom line, if it wasn’t for the increase in coronavirus cases in Colombia over the past 80 days in the 27 cities of Apartadó, Armenia Barrancabermeja, Barranquilla, Bello, Buenaventura, Bucaramanga, Bogotá, Cali, Cartagena, Cúcuta, Envigado, Ibagué, Itagüí, Medellín, Monteria, Neiva, Pasto, Pereira, Santa Marta, Sabanalarga, Sincelejo, Soacha, Soledad, Valledupar and Villavicencio and Zipaquirá, Colombia would have a much flatter curve of daily new coronavirus cases, shown in the blue line in the above chart.
We track the number of new coronavirus cases in Colombia reported daily and will provide updates on the 27 problem cities in Colombia daily.
Sign up for the Free Medellin Guru Newsletter – You can see all of the previous Medellin Guru weekly email newsletters and sign up here.
Editors note: updated on May 19, 2020 with coronavirus statistics for May 18 and added San Andrés de Tumaco to the list of cities.
Editors note: updated on May 21, 2020 with coronavirus statistics for May 20 and added list of orange zones in Bogotá.
Editors note: updated on May 22, 2020 with coronavirus statistics for May 22.
Editors note: updated on May 24, 2020 with coronavirus statistics for May 23.
Editors note: updated on May 25, 2020 with coronavirus statistics for May 24.
Editors note: updated on May 26, 2020 with coronavirus statistics for May 26.
Editors note: updated on May 28, 2020 with coronavirus statistics for May 27.
Editors note: updated on May 31, 2020 with coronavirus statistics for May 30.
Editors note: updated on June 2, 2020 with coronavirus statistics for June 1 and added Soacha and Ituango to the list of problem cities.
Editors note: updated on June 3, 2020 with coronavirus statistics for June 2 and added Malambo and Quibdó to the list of problem cities.
Editors note: updated on June 8, 2020 with coronavirus statistics for June 7.
Editors note: updated on June 15, 2020 with coronavirus statistics for June 14.
Editors note: updated on June 16, 2020 with coronavirus statistics for June 15 and added Medellín to the list of problem cities.
Editors note: updated on June 22, 2020 with coronavirus statistics for June 21 and added Santa Marta, Galapa and Sincelejo to the list of problem cities.
Editors note: updated on June 29, 2020 with coronavirus statistics for June 28 and added Pasto to the list of problem cities.
Editors note: updated on July 7, 2020 with coronavirus statistics for July 6 and added Baranoa to the list of problem cities.
Editors note: updated on July 26, 2020 with coronavirus statistics for July 24 and added Bello, Itagüí, Monteria and Puerto Colombia to the list of problem cities and removed Ituango.

